
Hydrogen Bond Analysis and Electron Density Mapping Services
QM Magic Class | Chapter 42
< Magical Power of Quantum Mechanics
Hydrogen Bond (HB) is a common intramolecular and intermolecular interaction. From DNA to structural proteins to enzymes to ligands, HB plays important roles in their structural and biological functions. It is one of the key non-covalent interactions for optimization in drug and new materials design [1]. In general, hydrogen bond can be expressed as “XH….YZ”, where “….” represents hydrogen bond, with the hydrogen connected to the electronegative atom X as a hydrogen bond donor, and electron-rich atom Y as the hydrogen bond acceptor, via electrostatic interaction. The most widely used method for judging hydrogen bonds is the bond length. The shorter the hydrogen bond, the stronger the strength. Recently with better understanding of hydrogen bonds and broadening of its scope (e.g. the hydrogen bond acceptor Y is not limited to lone pair electrons; it can also be anions, or π electrons), we could use better method to visualize and even quantify these interactions [2,3].
Visualizing Hydrogen Bonds Using Electron Density Maps
In quantum chemistry, electron density is a measure of the probability that an electron exists in a unit of space around a given point. A surface connecting points of equal value, that is, an isosurface, can be displayed as an array of dots, a mesh, solid or translucent surface. The electron density between atoms reveals the presence of interactions and correlates with the relative strength of these “bonds” [4,5].
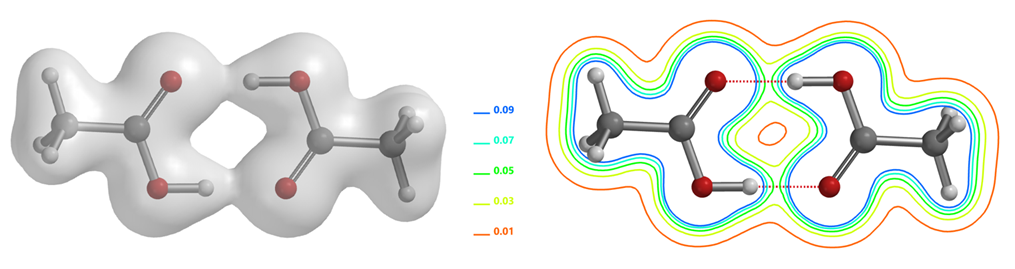
As shown in the electron density map of acetic acid dimer in Figure 1, we could see electron density between O and H of the two hydrogen bonds and the three-dimensional boundary of electron density between the hydrogen bonds [2]. This varies along the hydrogen bond, connecting the atoms like a bridge. In addition, we could also visualize electron density in the form of contour (slice) map. In recent years, scientists discovered that there is no clear boundary between hydrogen bonds and covalent bonds, and the essence of short and strong hydrogen bonds can be described as a covalent bond [6].
Determining Hydrogen Bond Strength in Molecules Using Electron Density Maps
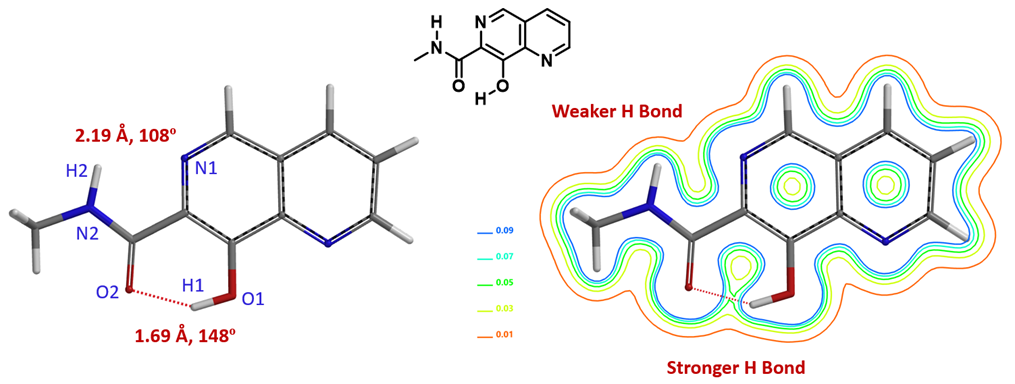
For molecules with multiple hydrogen bonds, it is quite straightforward to evaluate relative strength of these intramolecular interactions with QM calculated electron density map. This could be exemplified with 8-hydroxy-N-methyl-1,6-naphthyridine-7-carboxamide (Figure 2) with O2-H1 distance of 1.69 Å and O2-H1-O1 bond angle of 148°. This satisfies most modeling software’s criteria of hydrogen bond: An N or O -linked hydrogen between 1.6 Å and 2.1 Å from another O or N, and the XH….Y bond angle is >120° [4]. From the electron density contour map, we could see the hydrogen bond between O2-H1 is relatively stronger and the one between N1-H2 is relatively weaker. Note that the latter (N1-H2 distance of 2.19 Å and the N1-H2-N2 bond angle of 108°) does not meet the narrow criteria of “hydrogen bond” [4].
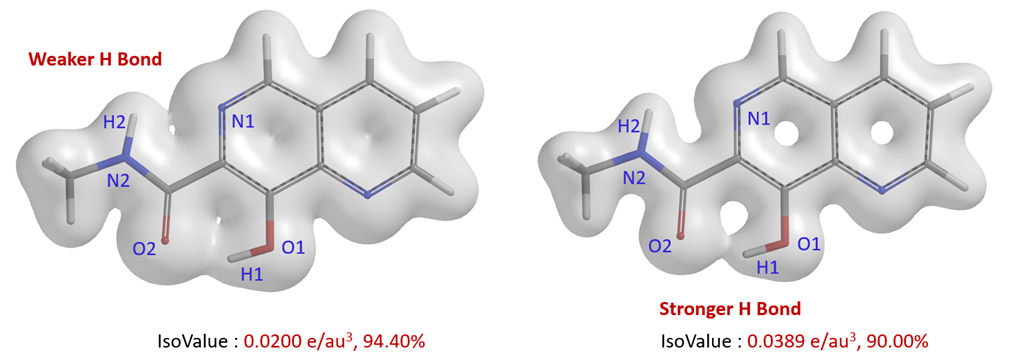
The weaker hydrogen bonding interaction between N1-H2 can also be visualized with semi-transparent surface of the electron density map (Fig. 3). When IsoValue is set to 0.0200 e/au3, it can be clearly seen that there is bridging electron density between O2-H1 and N1-H2 and their difference. We could also set the IsoValue to a larger threshold of 0.0389 e/au3 to visualize the difference [5].
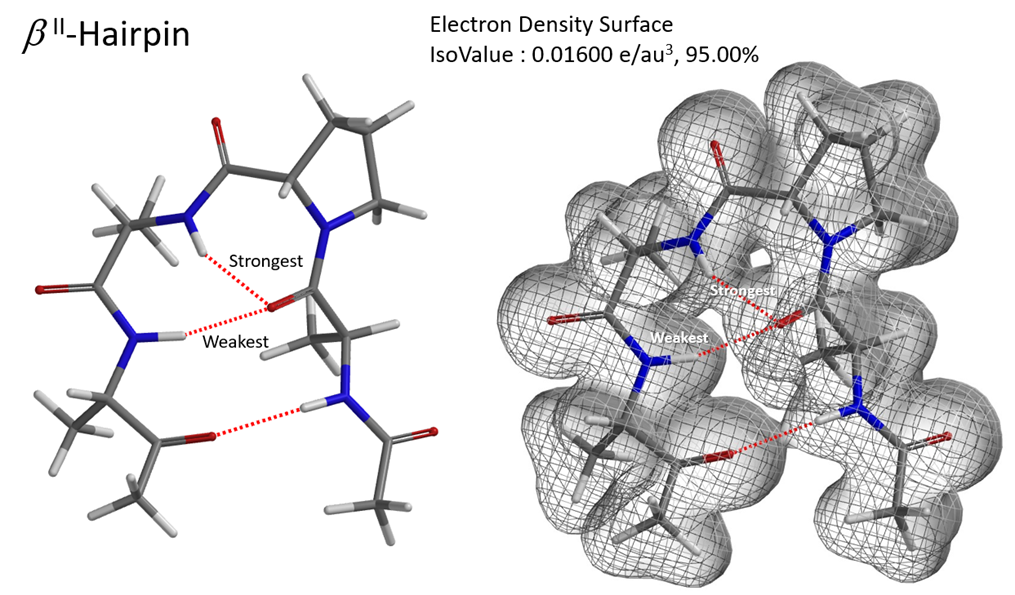
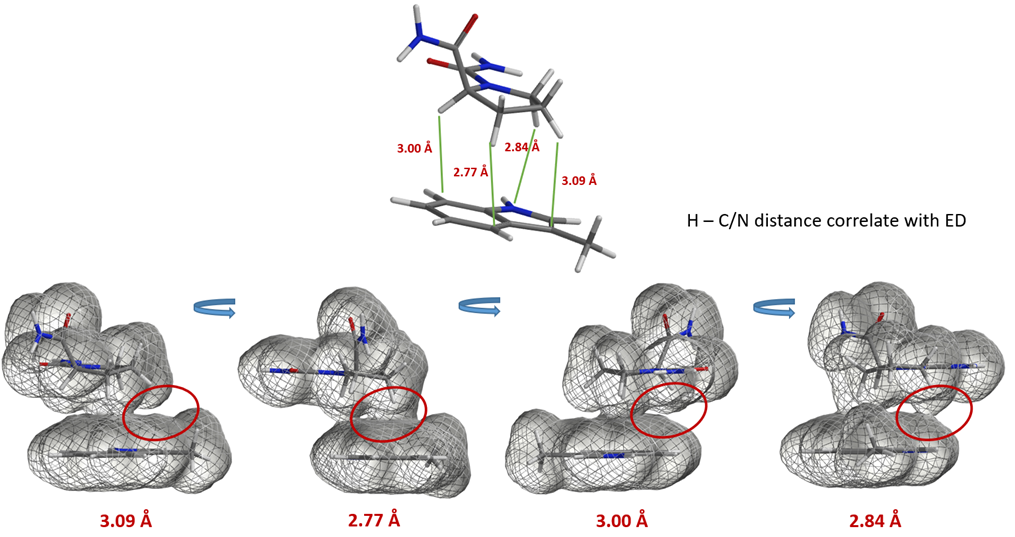
Hydrogen bonding is of great significance to biological macromolecules. It is an important factor in determining the secondary, tertiary, and quaternary structures of proteins and nucleic acids. Hydrogen bonding interactions in complex structures can be visualized with QM calculated electron density map. This could be exemplified with the three-dimensional structure of a tetrapeptide which folds into a hairpin-like configuration through hydrogen bonding [7]. Since the three hydrogen bonds are not coplanar, it is easier to visualize them and compare their relative strength with the mesh representation of its electron density surface (Figure 4).
Effect of Hydrogen Bonding on Reactivity
We learned that transition state stabilized by hydrogen bonding could speed up the reaction by lowering the activation energy [8]. However, when the reactant is stabilized by hydrogen bonding, this will need to be broken for the reaction to proceed, raising the energy barrier.
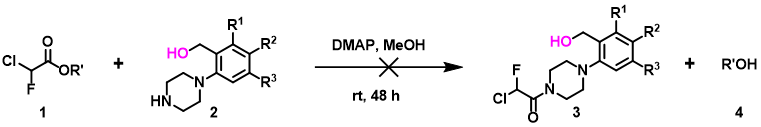
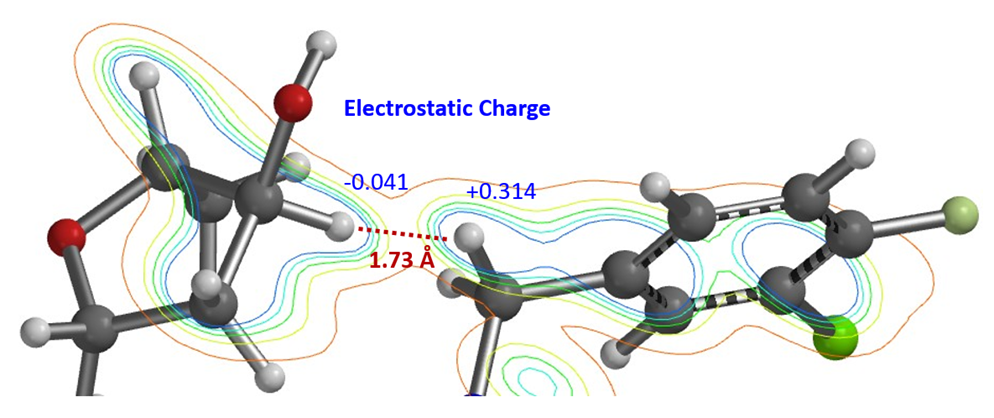
In the ester amidation shown in Figure 5, the des-hydroxy analog of substrate 2 proceeded efficiently to the corresponding amide. In the presence of the hydroxy group, the reaction does not occur at all under the same reaction conditions. QM analyses suggest that substrate 2 could form a hydrogen bond complex with the methanol solvent, involving two hydrogen bond interactions between the proton of OH in compound 2 and the N in NH, with an energy drop of 5.59 kcal/mol (Figure 6). We reasoned that for the desired nucleophilic attack to occur, the reaction needs to break both hydrogen bonds first, resulting in an increase in the activation energy, and thus the reaction does not occur. Since methanol solvent is essential for amidation, we could avoid formation of the above-mentioned complexes with silyl protection of the hydroxyl group prior to acylation of piperidine 2.
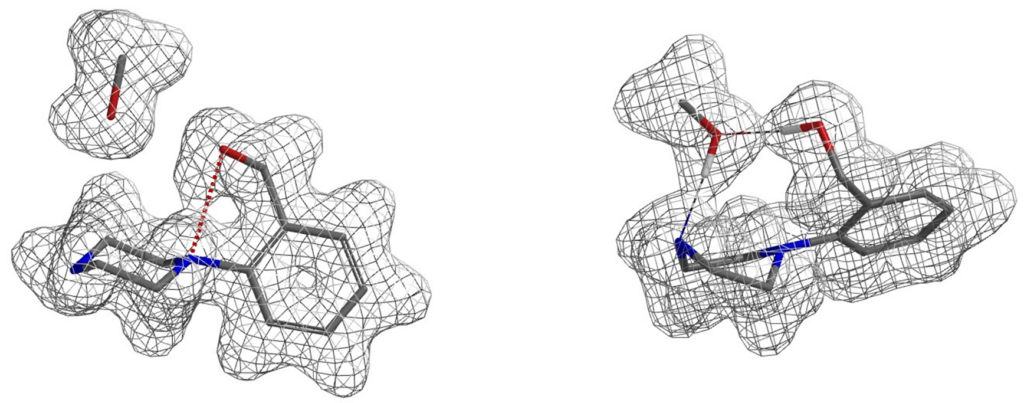
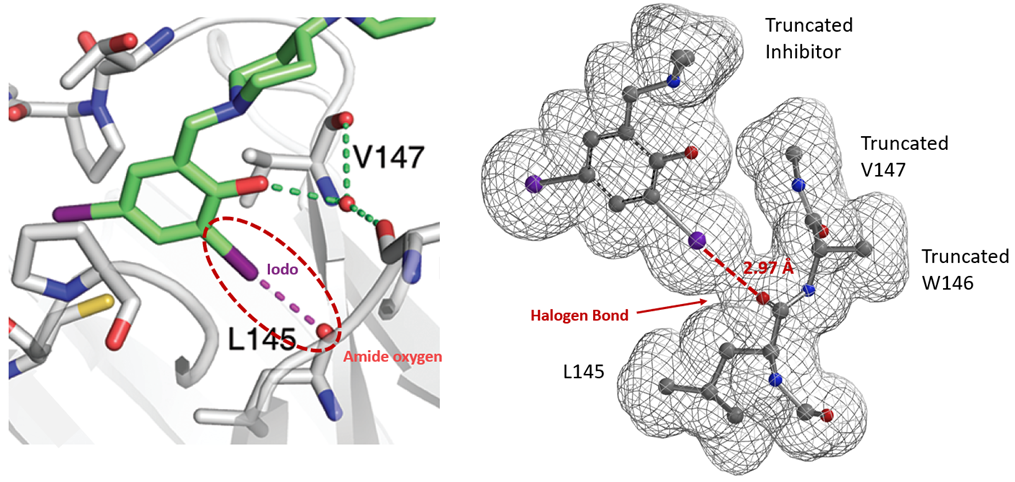
Similarly, electron density maps also enable us to visualize and compare various non-covalent interactions in drug discovery [9], such as halogen bond inhibitor binding pocket (Figure 7) [10], lone pair-π interaction in biological systems (Fig. 8) [11], proline-pi interaction (Fig. 9) [12], dihydrogen bond (Fig. 10) [13], etc.
In summary, electron density map enables us to visualize and compare the relative strength of intermolecular and intramolecular hydrogen bonds. When there are multiple hydrogen bonds that are not in the same plane, the mesh representation of the electron density surface map could be very useful. The same method can also be applied to other non-covalent interactions in analysis of chemical reactions and biological systems, providing us with better understandings to these interactions, crucial in drugs, materials, or ligands designs. Visualizing these non-covalent interactions is conceptually simple yet very powerful. What matters more is proper analyses of these density maps to generate crucial insights to guide drug designs and accelerate discoveries.
Building on What We Just Learned
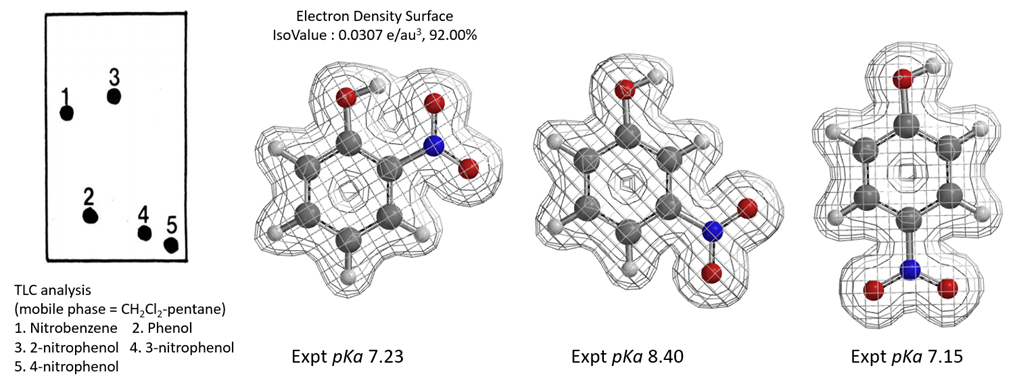
A. Feigenbaum reported that on silica gel TLC plate, polarity of o-nitrophenol is lower than that of p-nitrophenol and m-nitrophenol. With DCM-pentane as mobile phase, the polarity is even lower than that of nitrobenzene [14]. Polarity of p-nitrophenol and m-nitrophenol is close to that of phenol. Are the differences due to acidity, or hydrogen bonding? Based on the pKa and electron density surface maps of the three molecules shown in Figure 11, what will be your conclusions?
References:
[1] L.J. Karas, C.H. Wu, R. Das, J.I.C. Wu, WIREs Comput. Mol. Sci., 2020, 10, 1477.
[2] Definition of the hydrogen bond (IUPAC Recommendations 2011): E. Arunan, G. Desiraju, R. Klein, J. Sadlej, S. Scheiner, I. Alkorta, D. Clary, R. Crabtree, J. Dannenberg, P. Hobza, H. Kjaergaard, A. Legon, B. Mennucci, D. Nesbitt, Pure Appl. Chem., 2011, 83, 1637.
[3] QM Chapter 23: A QM Study of the para Regioselectivity of TBABr3 Bromination.
[4] Spartan’20 Tutorial and User’s Guide. Irvine, CA, USA: Wavefunction, Inc. 2021; p 256, 362, 368.
[5] https://en.wikipedia.org/wiki/Electron_density
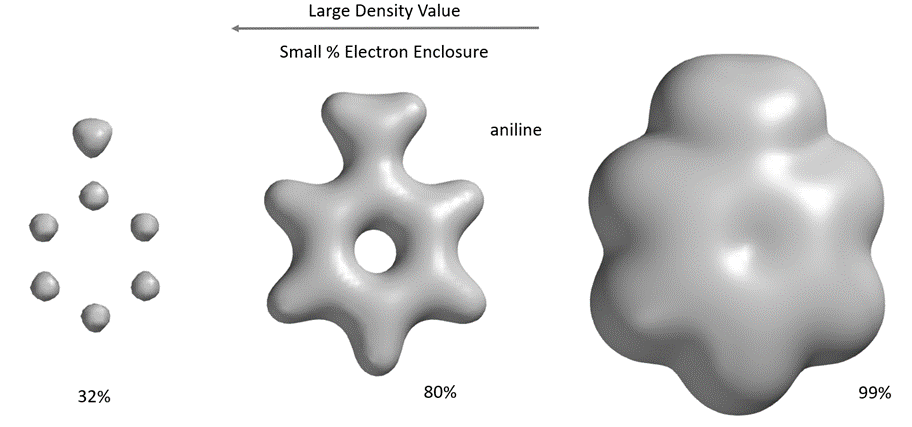
A space-filling model formed by an electron-dense surface containing the majority (>99%) of electrons in a molecule, a van der Waals surface. The electron-dense surface, which contains about 80% of the electrons, reveals the connections (“bonds”) between atoms. The highest electron density is distributed around the atoms. Different electron density surfaces can reflect different volumes and shapes of molecules.
[6] B. Dereka, Q. Yu, N.H.C. Lewis, W.B. Carpenter, J.M. Bowman, A. Tokmakoff, Science, 2021, 371, 160.
[7] R.W. Hoffmann, Angew. Chem. Int. Ed., 2000, 39, 2054.
[8] Examples in QM chapters 15, 23, 26 and 33 illustrated the effect of hydrogen bondings on activation energies.
[9] E.R. Johnson, S. Keinan, P. Mori-Sanchez, J. Contreras-Garcia, A.J. Cohen, W.T. Yang, J. Am. Chem. Soc., 2010, 132, 6498. Non-covalent interactions have a unique signature, and their presence can be revealed solely from the electron density. They are highly non-local and manifest in real space as low-gradient isosurfaces with low densities.
[10] G. Cavallo, P. Metrangolo, R. Milani, T. Pilati, A. Priimagi, G. Resnati, G. Terraneo, Chem. Rev. 2016, 116, 2478.
[11] J. Novotný, S. Bazzi, R. Marek, J. Kozelka, Phys. Chem. Chem. Phys., 2016, 18, 19472.
[12] T. Ozawa, K. Okazaki, K. Kitaura, Journal of Computational Chemistry, 2011, 32, 2774.
[13] S. Hare, A.M. Vos, R.F. Clayton, J.W. Thuring, M.D. Cummings, P. Cherepanov, Proc Natl Acad Sci USA, 2010, 107, 20057.
[14] A. Feigenbaum, J. Chem. Edu., 1986, 63, 815.
