
Exploring the Reaction Mechanism of Menke Nitration
QM Magic Class | Chapter 22
< Magical Power of Quantum Mechanics
Nitration is a common reaction in organic synthesis, and a large variety of nitration reagents and reaction conditions are reported in the literature. Menke Nitration, first reported by Menke in 1925 [1], refers to the nitration of aromatic compounds by reaction with copper nitrate and acetic anhydride. A reaction mechanism proposed in the current literature is shown below [2].
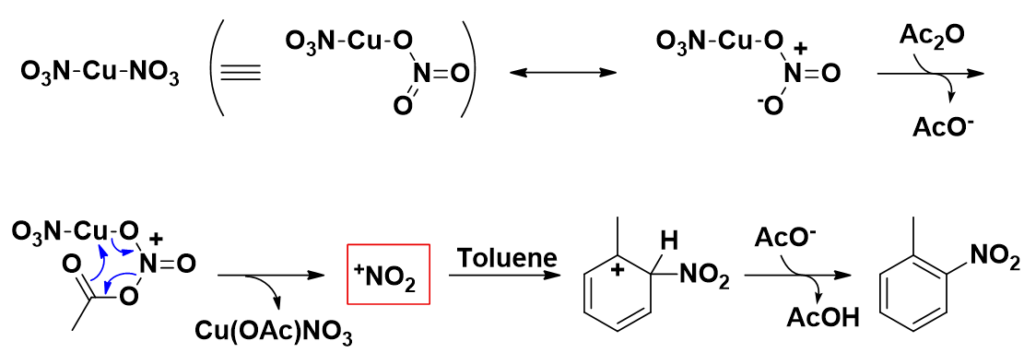
In 1960 F. G. Bordwell et al. [3] found that olefins can react with AcONO2 in the nitration system of nitric acid-acetic anhydride, and suggested that protonated acetyl nitrate (AcOHNO2)+ may be the active species for nitration. Inspired by this, we speculate that it is AcONO2 rather than NO2+ that is involved in Menke Nitration, and decide to use QM calculations to evaluate our hypothesis.
Reaction Modeling
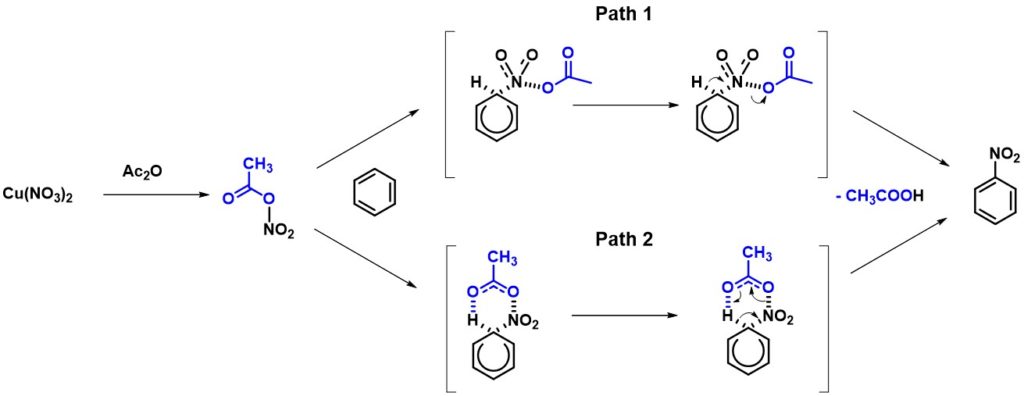
For Menke nitration, copper nitrate reacts with acetic anhydride to form the intermediate AcONO2. We reasoned that the following two reaction pathways are possible (Figure 2). Path 1: the electrophilic substitution reaction of the intermediate AcONO2 with benzene ring, then departure of H+ to form the product and acetic acid. Path 2: nitration proceeds via a six-membered ring transition state, with an intramolecular transfer of the “aromatic” H to the acetate group in a concerted manner.
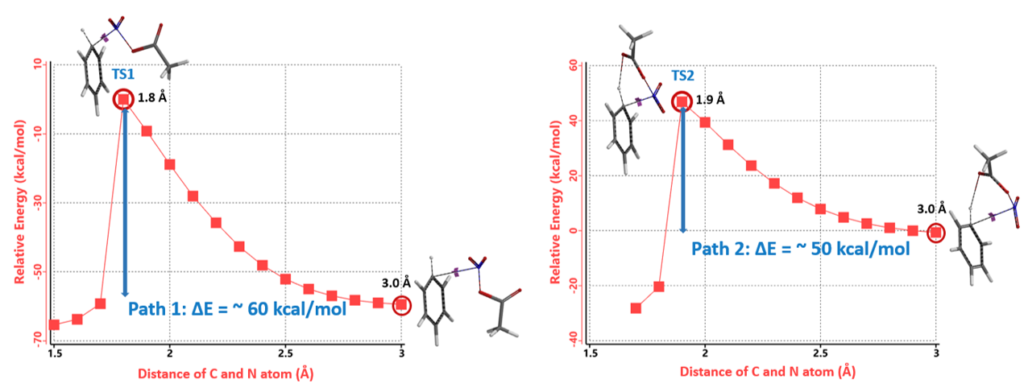
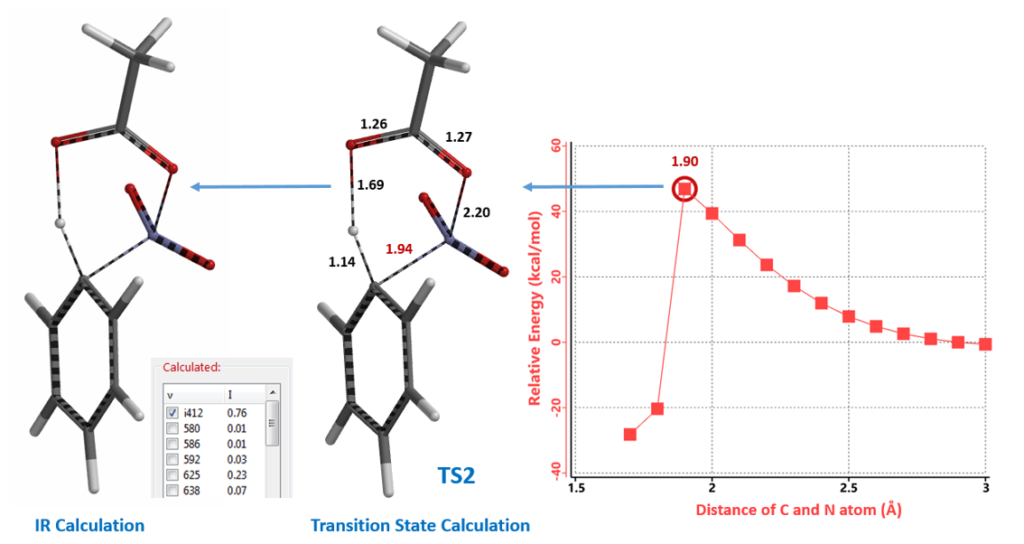
To evaluate which potential reaction pathway is energetically more favorable, we calculated for both reaction energy profiles, with the aromatic C to nitro group N distance changing from 3.0 Å to 1.5 Å over 16 steps. These calculations suggest Path 1 and 2 will have activation energy of ~ 60 and ~50 kcal/mol, respectively. Path 2 is ~10 kcal/mol lower than that with Path 1 (Figure 3), suggestive of reaction mechanism with a six-membered ring transition state.
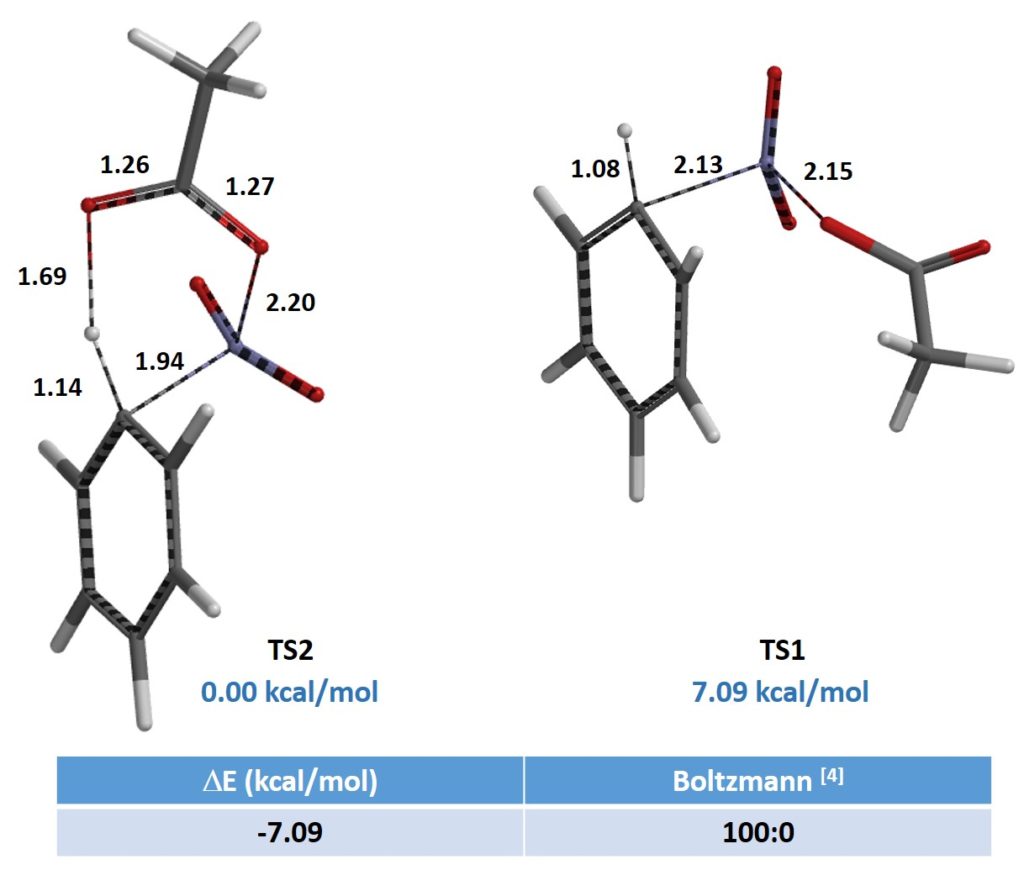
The structures TS1 and TS2, at the highest points in the two reaction energy profiles, were then used to calculate for more accurate “Transition State Geometry” and to determine their relative energy difference. Energy of TS2 is found to be 7.09 kcal/mol lower than that of TS1, with a Boltzmann distribution favoring TS2 by 100% (Figure 4), presumably from the intramolecular hydrogen bond stabilization in TS2.
Infrared vibration calculation of structure TS2 showed one and only one imaginary frequency at i412 cm-1 (Figure 5) [5]. Intrinsic Reaction Coordinate (IRC) calculation of TS2 reaches both the starting material and nitration product. These results provide further support that TS2 could be a viable transition state for Menke Nitration.
Refining and Validating the Menke Nitration Model
Menke nitration of chroman 1 provided a 3 : 1 mixture of 6- and 8-nitro products, respectively. We will use this example to illustrate how we use calculated HOMO and 13C NMR data of a substrate (Chapter 2 ) along with the above Menke nitration model to predict and quantify the regio-selectivity observed.
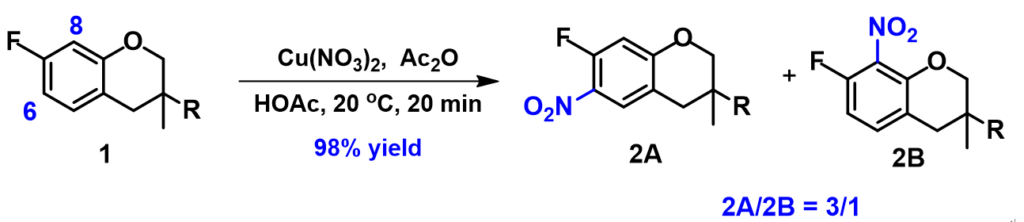
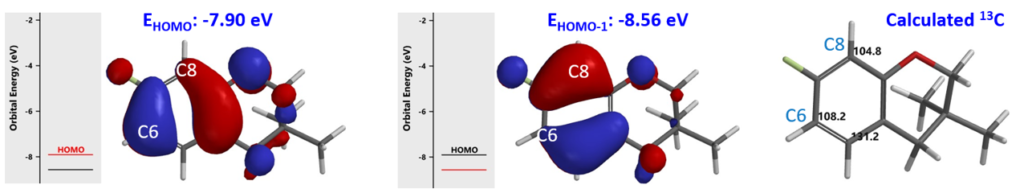
The R-group of chroman 1 was simplified to a methyl group for faster calculations. Energy difference between HOMO and HOMO-1 is 0.66 eV (Figure 7). HOMO lobe on C-6 is significantly larger than that on C-8, while the HOMO-1 lobe on C-8 is significantly larger than that on C-6. Calculated 13C NMR showed a chemical shift difference of < 6 ppm between C-6 (108.2 ppm) and C-8 (104.8 ppm). These calculated parameters could account for the observation of a mixture of 2A and 2B nitration products, with 2A as the major one.
To refine the Menke Nitration reaction model proposed above, we first calculated for the reaction energy profiles for nitration at C-6 and C-8. The estimated activation energies are found to be ~38.7 kcal/mol and ~42.6 kcal/mol, respectively, favoring C-6 nitration.
Then we selected the structures that correspond to the highest energy point of the two energy profiles to calculate for “Transition State Geometry” of TS6 and TS8 (Figure 8) and their relative energy differences with various dielectric constants settings (CPCM model). Results are tabulated in Table 1.
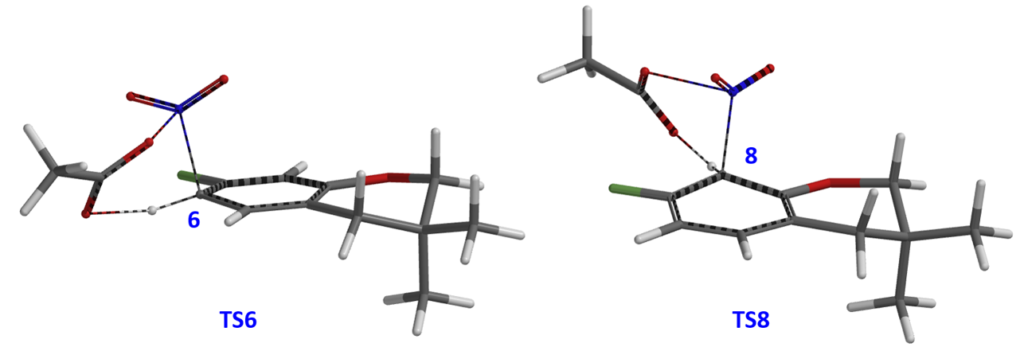
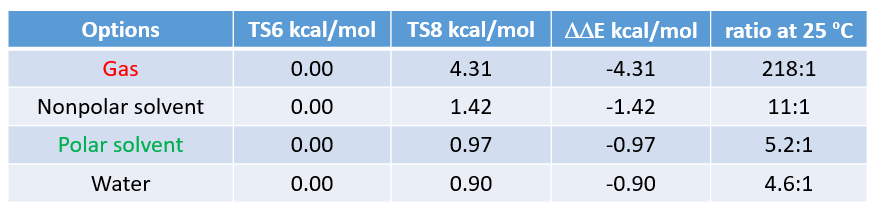
“Polar solvent” (dielectric constant of 37), consistent with acetic acid being used as solvent in the reaction, shows the best correlation with the experimental result of 3:1. This further substantiates the hypothesis that AcONO2 is the active nitrating species in Menke Nitration, the reaction proceeds via a six-membered ring transition state, and the model is useful to predict and quantify regio-selectivity of Menke Nitration.
This chapter highlights the use of QM calculation to evaluate possible mechanisms of a reaction, the use of transition state geometry and ifrequency calculations to further assess the models, and the use of experimental results to refine necessary dielectric settings used in calculations to better quantify regio-selectivity observed. Validated QM reaction models are powerful prospective analysis tools in synthetic planning, and their refinement with experimental data will lead to better mechanistic understanding of reactions of interest.
Building on What We Just Learned
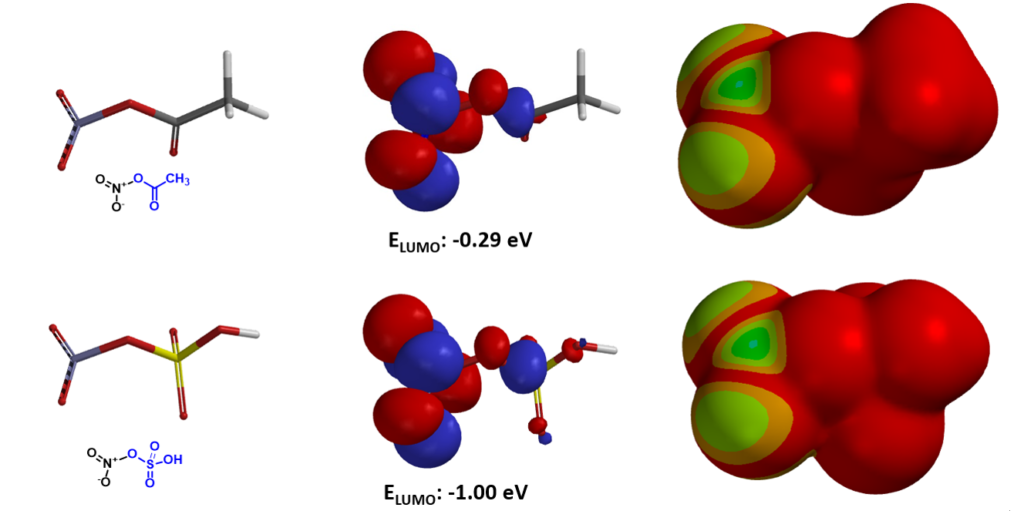
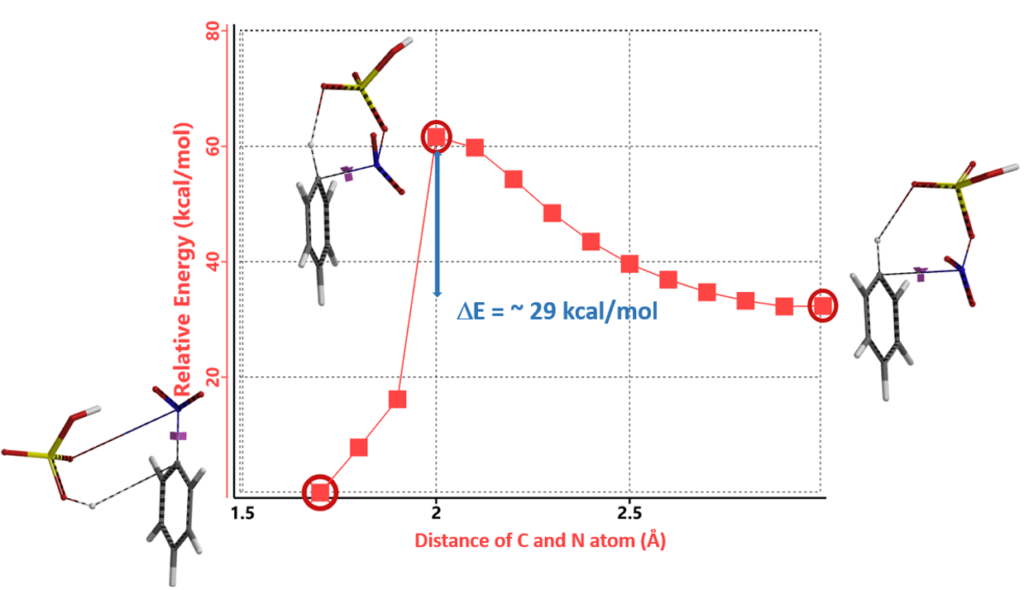
HSO3ONO2 (LUMO energy of -1.00 eV, Figure 9) is much more electrophilic than AcONO2 (LUMO energy -0.29 eV), could be generated by the reaction of anhydrous HNO3 with SO3 in fuming sulfuric acid, and its use patented in a remarkable continuous and closed-loop process for nitration of dinitrotoluene to TNT, at a relatively low temperature of 70-90 °C [6]. Based on the QM analysis of Menke nitration discussed above, the reaction energy profile of HSO3ONO2 nitration of benzene (Figure 10), the transition state structure, and an imaginary frequency (i194 cm-1), an obvious question emerges: mechanistically could both AcONO2 and HSO3ONO2 nitration proceed through analogous six-membered ring transition states?
References:
[1] (a) Menke, J. B. Recl. Trav. Chim. Pays-Bas, 1925, 44, 141. (b) Menke, J. B. Recl. Trav. Chim. Pays-Bas, 1925, 44, 269. (c) Menke, J. B. Recl. Trav. Chim. Pays-Bas, 1925, 44, 270.
[2] Wang, Z. Comprehensive Organic Name Reactions and Reagents, volume 2. John Wiley & Sons, Inc., Hoboken, New Jersey, US, 2009, 1893.
[3] Bordwell, F. G., Garbisch, E. W. Jr. J. Am. Chem. Soc., 1960, 82, 3588.
[4] The Boltzmann distribution function describes the probability distribution of molecules according to the level of energy under thermal equilibrium.
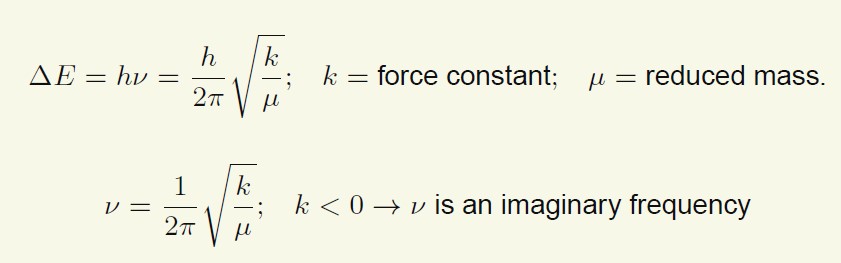
[5] Spartan ’18 Tutorial and User’s Guide (2019). Irvine, CA, USA: Wavefunction, Inc. pages 152, 495, & 613. In computational chemistry, molecular vibrations at the transition state can be described approximately with a harmonic oscillator model. As shown in the equation below, the vibration frequency is proportional to the square root of the ratio of force constant k and reduced mass μ (a combination of the masses of atoms involved in motion along that coordinate). The force constant k is the curvature of the potential energy surface along a specific coordinate (defined by the second derivative of the energy relative to the geometric coordinate). See Chapter 8 Transition State Theory and the transition state is located at the saddle point on the potential energy surface. The curvature of the transition state on the reaction path is negative and the reduced mass is positive, so the frequency calculated is an imaginary number. Having one and only one imaginary frequency that corresponds to vibration of the bonds being made/broken is a crucial criteria to satisfy for the calculated structure to be considered as a transition state.
[6] Hill, M. E., Tolber, W. E., McDonald, G. J. US Patent 3,799,993, March 26, 1974.
This article is written and edited by Xiaoli Shen, Tommy Lai, Dong Pan, Yongsheng Chen, and John S. Wai.
