
Application of Torsion Scan in Medicinal Chemistry
QM Magic Class | Chapter 14
< Magical Power of Quantum Mechanics
We learned about dihedral angle and torsional strain in Chapter 13. In this chapter, we will discuss torsion scan, a valuable tool for medicinal chemists to evaluate what are the likely active conformations of their drug molecules and to assess potential atropisomerism.
Application of Torsion Scan in Drug Design
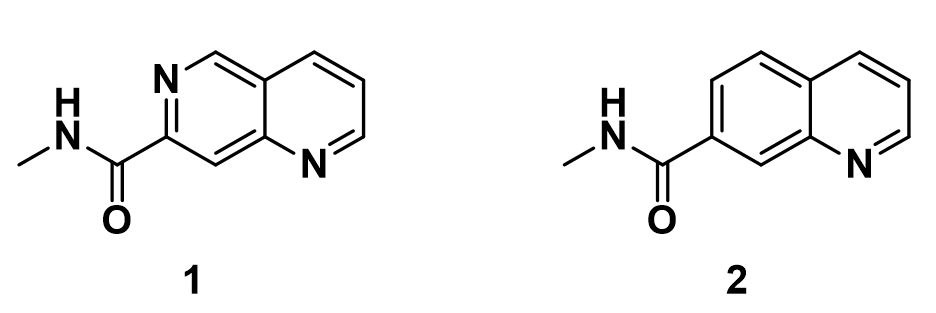
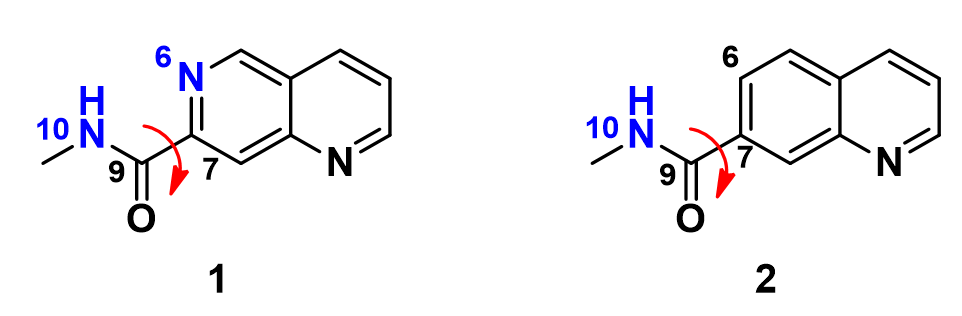
Shown on Figure 1 are 2D structure of two drug molecules, in which naphthyridine amide 1 has excellent inhibitory activity, while quinoline amide 2 exhibits much lower biological activity. These two chemical structures differ only at position 6 with one having a nitrogen atom and the other having a carbon atom, respectively.
In this situation, we conduct a torsion scan with Density Functional Theory calculation, rotating the dihedral bond in 20° increment from 0° to 360° between the amide plane and the aromatic core for these two inhibitors, to compare their energy profiles.
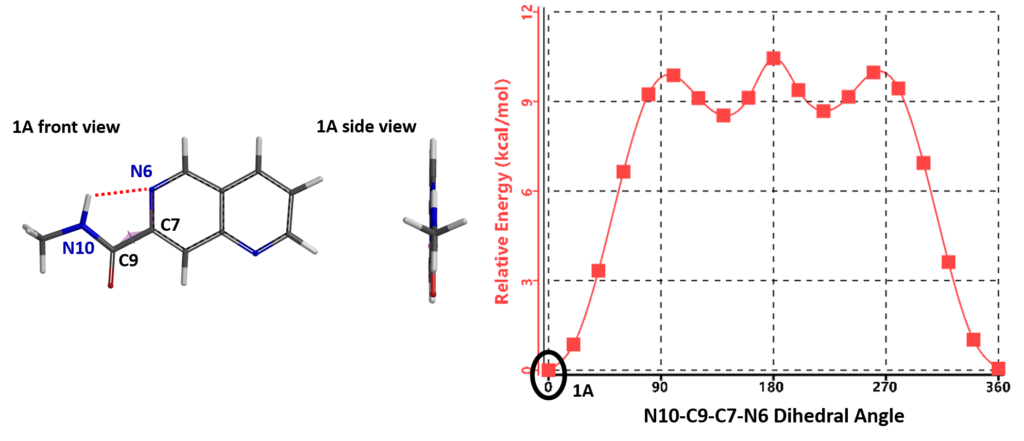
The torsion scan energy profile of naphthyridine 1 is shown in Figure 3, with 1A being the lowest energy conformation. In this conformation, the amide group is coplanar with the naphthyridine ring and its N10-H is hydrogen bonding with the N6 of the naphthyridine.
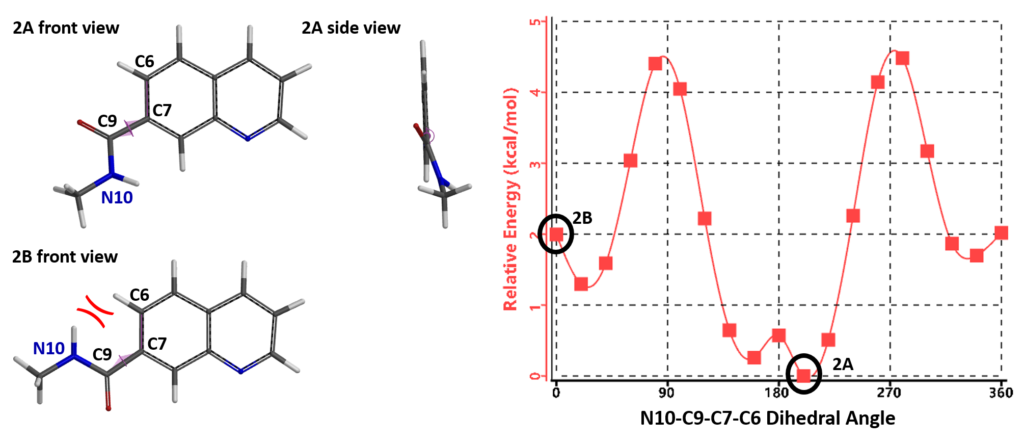
Quinoline amide 2, with the N6 atom on the naphthyridine ring replaced with a C atom, loses the intramolecular hydrogen bonding, as shown in Figure 4, conformation 2B. Furthermore 2B encounters steric congestion between the N10-H and C6-H. As such, the lowest energy conformation of quinoline amide 2A adopts a N10-C9-C7-C6 dihedral angle at 200° with the amide group being non-coplanar to the quinolone. To adopt the ground state conformation as naphthyridine 1A, the quinoline conformation 2B will be 2 kcal/mol higher than its ground state 2A.
Since naphthyridine 1 is more biologically active, we can speculate that its coplanar structure is likely to be the dominant conformation for target binding, and that the orientation of the carbonyl group and/or the amino group in the amide might also be biased for specific hydrogen bonding with the target. This provides an important guide for the design of drug molecules in our next step.
On top of assisting us in analyzing the low-energy conformations of drug molecules, we found torsion scan to be very useful in analyzing the rotational isomers (Atropisomerism), providing guidance for their separation, and enabling us to assess whether this could pose significant challenges for further development of these molecules. [1]
Application of Torsion Scan in Separation and Characterization of Drug Targets
1H NMR spectroscopy revealed that in our preparation of pyrazolyl triazole derivative 3, a mixture of two compounds was obtained (Figure 5). Could they be regio-isomers? After this mixture was subjected to Supercritical Fluid Chromatography (SFC) on chiral stationary phase, we found that the enriched fractions quickly equilibrated back to same ratio. This makes more sense if the product is actually a mixture of rotational isomers, with hindered rotation of the C-N single bond across the pyrazole and triazole planes, instead of being a mixture of regio-isomers.
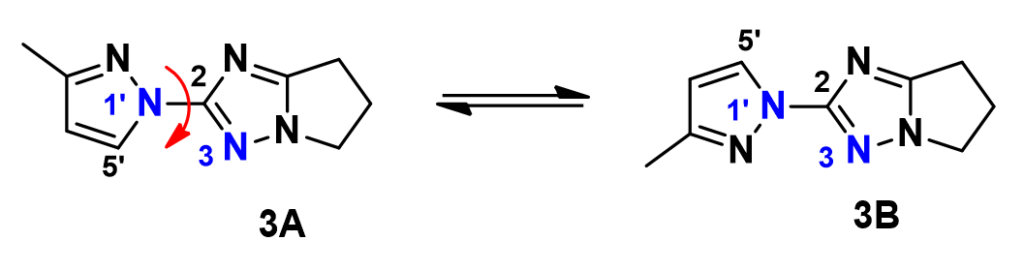
We have been able to further substantiate the conclusion with a QM torsion scan calculation of compound 3. Shown on Figure 6 is the energy profile of the torsion scan on dihedral angle N3-C2-N1’-C5’ from 0 to 360º, in 19 steps.
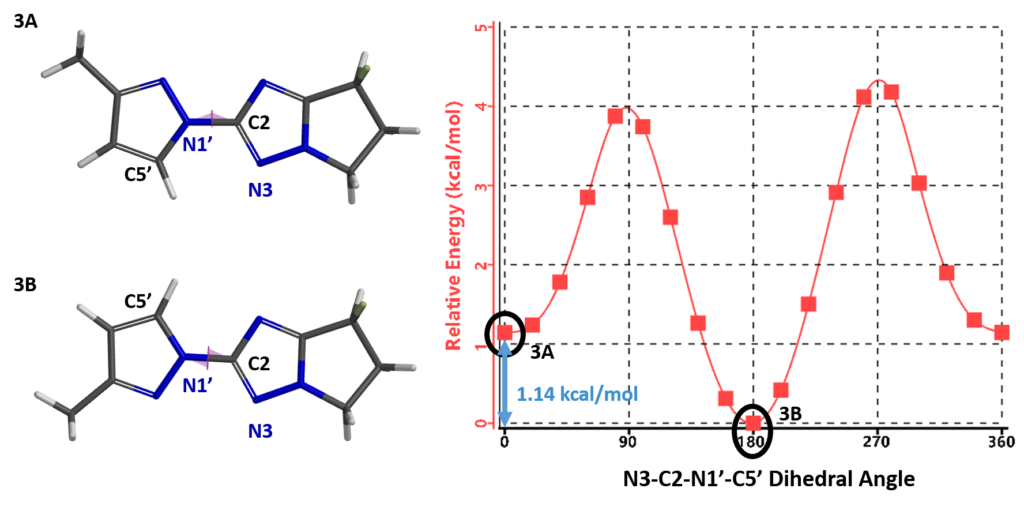
alculation shows an energy difference of around 1.14 kcal/mol for the two low-energy conformations, 3A and 3B. Based on the established relationship between Gibbs Free Energy change and equilibrium constant, ![]() , the energy difference translates to an equilibrium ratio of 3A : 3B ≈ 1:7 at 25 °C, consistent with experimental observation.
, the energy difference translates to an equilibrium ratio of 3A : 3B ≈ 1:7 at 25 °C, consistent with experimental observation.
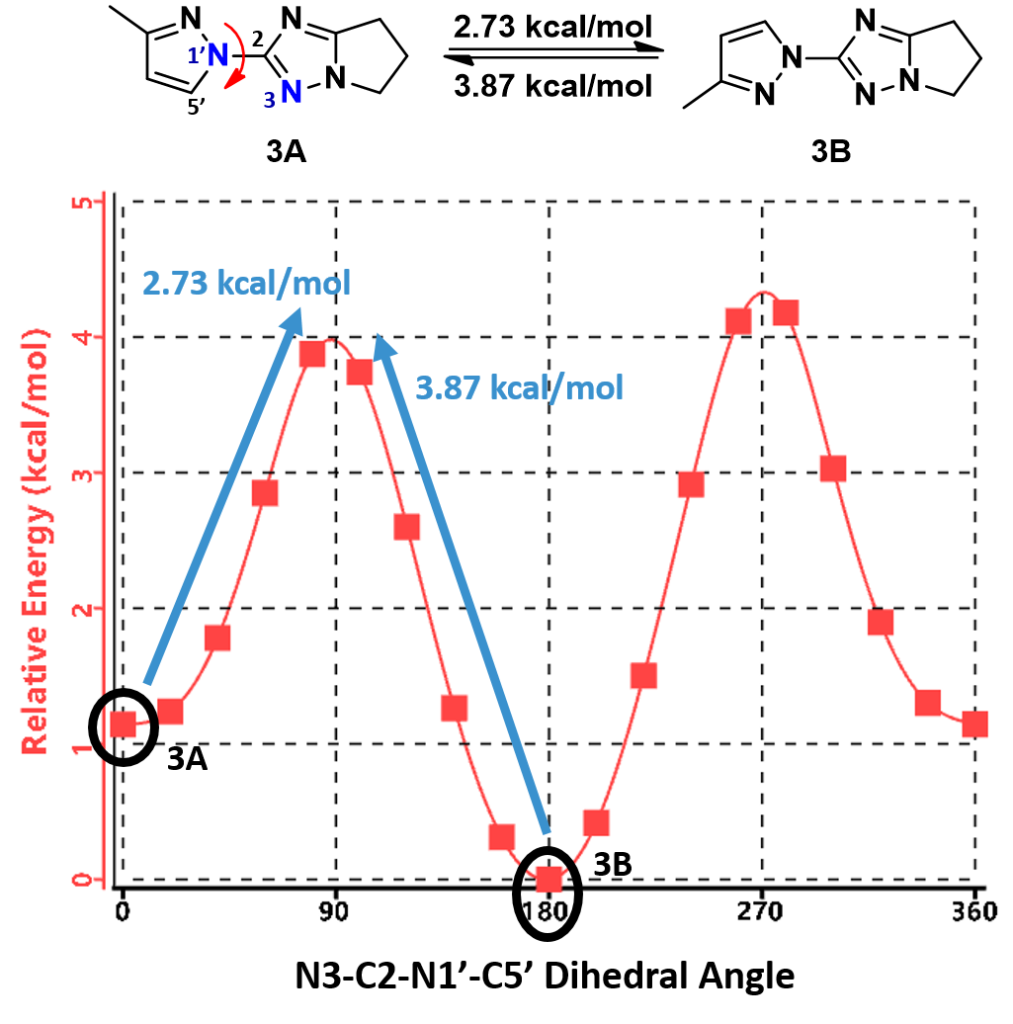
Furthermore, the calculation indicates that the energy barriers for the conversion of conformations are 2.73 (3A to 3B) and 3.87 kcal/mol (3B to 3A), respectively (Figure 7). These level of energy barriers are enough to slow down their interconversion for discrete 1H NMR signals of each rotamer and to have them partially separated with SFC. This is consistent with the report that an energy barrier higher than 23 kcal/mol (kinetic barrier [1]) is need to avoid the purified rotamers from equilibrating back to an equilibrium mixture, accounting for our observation that partially separated mixtures of pyrazolyl triazole rotamers reverse back to its equilibrium ratio.
In summary, torsion scan is a very powerful calculation tool for medicinal chemists to establish the likely active conformation of their inhibitors, to assess whether their targets of interest could exhibit atropisomerism, to estimate how quickly they could interconvert.
Building on What We Just Learned
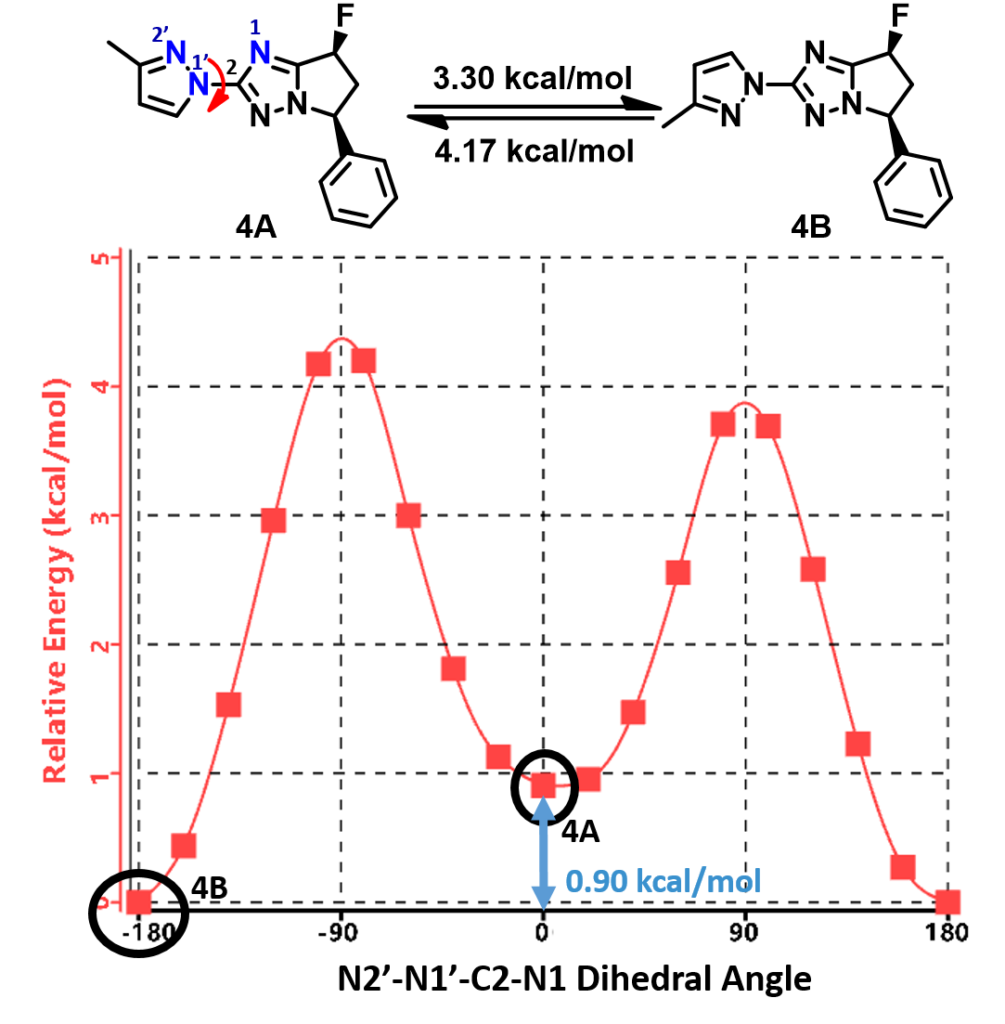
Shown on Figure 8 is the torsion scan energy profile calculated for the phenylated pyrazolyl imidazole analog 4. What will be the equilibrium ratio of these two rotamers (4A and 4B)? Is it likely we could separate and purify each of the rotamers for biological assays?
This article is written and edited by Zhengquan Zhou, Guqin Shi, Liting Dong, Dong Pan, and John S. Wai.
References:
[1] a) A. M. Belostotskii. Conformational Concept for Synthetic Chemist’s Use: Principles and in Lab Exploitation. Hackensack, NJ, USA: World Scientific Publishing, 2015. b) Kinetic Barrier: Atropisomers with low energy barriers usually exist as equilibrium mixtures due to their rapid interconversion. For them to be effectively purified/separated, the kinetic barrier generally has to be ≥ 23 kcal/mol, with a t1/2 at around 33 days, at 25°C. The interconversion rate is also affected by temperature and solvents.
